The reading page on this site started as a collaboration between the Claude browser extension and Claude Code. I used the browser extension to extract my Audible library into structured data, and Claude Code to build the page that displayed it. That first pass produced a clean list of 94 books grouped by category, with three hand-picked favorites at the top.
A few weeks later, I finished another audiobook and went to add it. That’s when I realized my Audible library had nearly 300 titles, and the page was only showing a third of them. What followed was a rebuild that touched every layer: data extraction, cover art sourcing, page design, and interactive visualization, all in a single session using three different AI interfaces.
Expanding the Data with the Browser Extension
The original 94 books came from the Claude browser extension reading my Audible library page. The same approach scaled to the full library, but the prompt needed to be more precise this time. The extraction had to match the site’s existing books.json schema exactly, preserving fields like series, seriesNumber, and favorite on books that were already tracked, while adding a new readOrder field based on each book’s position in the Audible library (sorted by date added).
I drafted the prompt in Claude Code, which understood the schema requirements from working on the site. The prompt included the current books.json as a reference and gave explicit rules: match by title and author, preserve existing fields, add readOrder as an integer, and output valid JSON. Claude Code helped me get the prompt right before I handed it to the browser extension.
The browser extension handled the matching and produced a replacement data file. The result was too large for a single response, so it came back in three parts. Claude Code combined and validated them. The library went from 94 to 292 books across 14 categories, with new sections that surfaced for the first time: Fantasy, Memoir, Classic Literature, Finance.
Cover Images at Scale
With 292 books, a text-only list felt incomplete. I wanted small cover thumbnails beside each entry. Sourcing 292 cover images manually wasn’t realistic.
Google Books API turned out to be the right tool. A quick test with three books confirmed it had good coverage and offered multiple zoom levels. The zoom=1 thumbnails were 128px wide at roughly 12KB each, perfect for small inline use without bloating the page.
I built a Node script (scripts/download-covers.mjs) that iterates through every book in books.json, searches by title and author, downloads the thumbnail, and saves it with a slugified filename. Rate-limited at 300ms between requests to stay polite. The script is idempotent: it skips files that already exist, so re-running it after adding new books only fetches what’s missing.
272 out of 292 covers downloaded successfully. The 20 failures were mostly Audible originals and niche titles that Google Books didn’t index. An onerror handler on each image element hides it gracefully when a cover isn’t available.
A second script (scripts/fetch-descriptions.mjs) followed the same pattern to pull short descriptions for hover cards. Same API, same rate limiting, same idempotent design.
The Reading Page
The original page was a single view: books grouped by category. With reading order data, a second view mode made sense. The implementation:
View toggle. Two pill buttons (“By Category” and “Read Order”) swap between layouts. The selection persists to localStorage so it survives page reloads and navigation. Both views render in the HTML at build time; the toggle just swaps visibility with a small inline script.
Category view. Same grouped layout as before, now with cover thumbnails and hover popovers. Each popover shows a larger cover image, the description, and series info.
Read order view. A flat reverse-chronological list numbered from 292 down to 1. Each entry shows the cover, title, author, and category label. The most recent reads appear at the top.
Favorites expansion. The favorites section previously showed series as a single card. Now it lists the individual books in each series with their own covers, so you can see all five Bobiverse books or all four Three-Body Problem books at a glance.
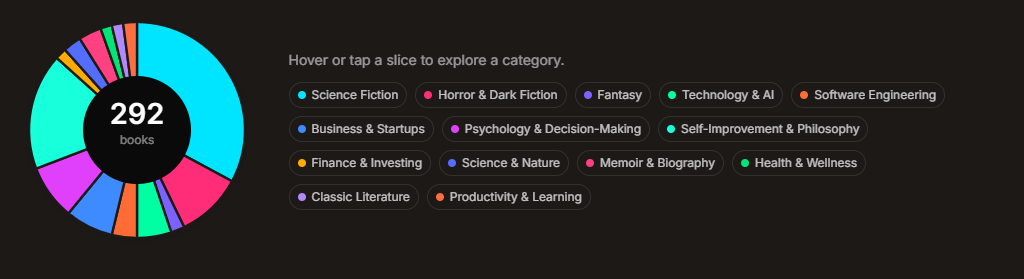
The Pie Chart
An interactive donut chart sits between the view toggle and the book lists, showing the category breakdown. The implementation is pure SVG, no charting library. Each segment’s arc path is computed in the Astro frontmatter from the category counts, and the SVG renders at build time.
Interactivity is handled with a small inline script. Hovering a slice scales it up and fades the others. A detail panel beside the chart shows the category name, count, and a row of sample book covers. Clicking a slice pins the selection; clicking again or clicking outside unpins it. The legend buttons below the chart mirror the hover behavior.
The color palette went through a few iterations. The initial Tailwind defaults were too saturated against the site’s stone-toned background. An all-gray palette was too indistinguishable. A set of muted earth tones was functional but flat. The final palette uses bright, distinct neon tones, a deliberate contrast that reads well against the neutral background and nods to the sci-fi shelf that dominates the collection.
Why this took three tools, not one
This wasn’t a single-tool project. Each phase used the right interface for what it needed:
- Browser extension for extracting structured data from a web page that has no API
- Prompt engineering to keep the extraction output schema-compatible with the site
- Claude Code for scripting (API calls, file downloads), page implementation, and iterative CSS/design work
- Human direction for every aesthetic choice: thumbnail sizes, color palettes, what to show in hover cards, which pie chart slices get labels
The iteration loop was fast because the feedback was visual and immediate: change the palette and look, resize the thumbnails and look, add the pie-chart labels, decide they were noise, pull them back out. Claude Code did the mechanics. Every aesthetic call was mine, and that division held for the whole session.
The reading page went from a static list of 94 books to an interactive library of 292 audiobooks with covers, descriptions, two view modes, and a category visualization, all in a single session. The tooling scripts are reusable, so adding the next book is one JSON entry and a re-run of the cover script.